Upbit, a leading South Korean cryptocurrency exchange, is a popular platform for traders worldwide. Understanding and effectively reading the Upbit chart is crucial for making informed trading decisions and maximizing potential profits. This guide delves into the intricacies of the Upbit chart, explaining its components and providing strategies for successful trading.
Deciphering the Upbit Chart's Anatomy
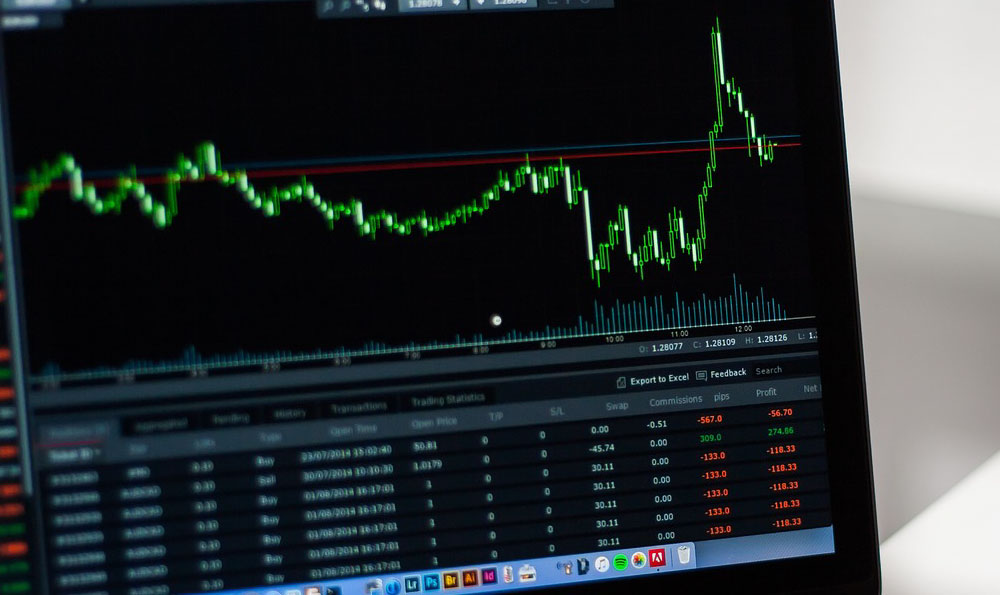
The Upbit chart, like most trading charts, primarily displays price movements over a specific timeframe. It typically presents data in candlestick format, although other chart types like line charts and bar charts are also available. Each candlestick represents a specific period, ranging from one minute to one month, displaying the opening price, closing price, highest price, and lowest price for that period.

-
Candlestick Components: A candlestick consists of a body and wicks (or shadows). The body represents the range between the opening and closing prices. If the closing price is higher than the opening price, the body is usually green (or white), indicating a bullish (positive) trend. Conversely, if the closing price is lower than the opening price, the body is typically red (or black), signaling a bearish (negative) trend. The wicks extend from the top and bottom of the body, representing the highest and lowest prices reached during the period. A long upper wick suggests significant selling pressure, while a long lower wick indicates strong buying interest.
-
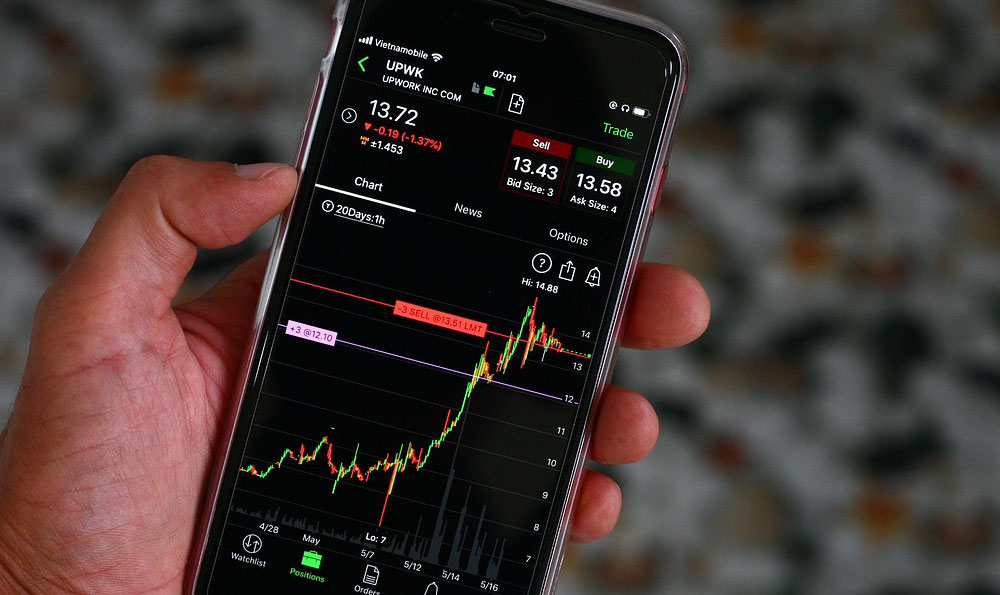
Timeframe Selection: Choosing the appropriate timeframe is essential. Short-term traders often use shorter timeframes (e.g., 1-minute, 5-minute, 15-minute) to identify intraday trading opportunities. Swing traders may prefer medium-term timeframes (e.g., 1-hour, 4-hour, daily), while long-term investors typically analyze longer timeframes (e.g., weekly, monthly) to identify overarching trends. The timeframe you select should align with your trading strategy and risk tolerance.
-
Volume: Volume, displayed at the bottom of the chart, represents the number of coins traded during a specific period. High volume often confirms the strength of a price movement. For instance, a significant price increase accompanied by high volume suggests strong buying interest, making the move more likely to be sustained. Conversely, a price increase with low volume might indicate a weak rally that is unlikely to last.
Essential Technical Indicators for Upbit Chart Analysis
Technical indicators are mathematical calculations based on historical price and volume data. They can provide valuable insights into potential price movements and help traders identify buy and sell signals. Here are some commonly used technical indicators for Upbit chart analysis:
-
Moving Averages (MAs): Moving averages smooth out price data by calculating the average price over a specified period. Common moving average periods include 50, 100, and 200 days. Traders often use moving averages to identify trends and potential support and resistance levels. For instance, if the price crosses above a moving average, it could signal a bullish trend. Conversely, if the price crosses below a moving average, it could indicate a bearish trend.
-
Relative Strength Index (RSI): The RSI is a momentum oscillator that measures the magnitude of recent price changes to evaluate overbought or oversold conditions. It ranges from 0 to 100. An RSI above 70 typically indicates an overbought condition, suggesting that the price may be due for a correction. An RSI below 30 usually indicates an oversold condition, implying that the price may be poised for a rebound.
-
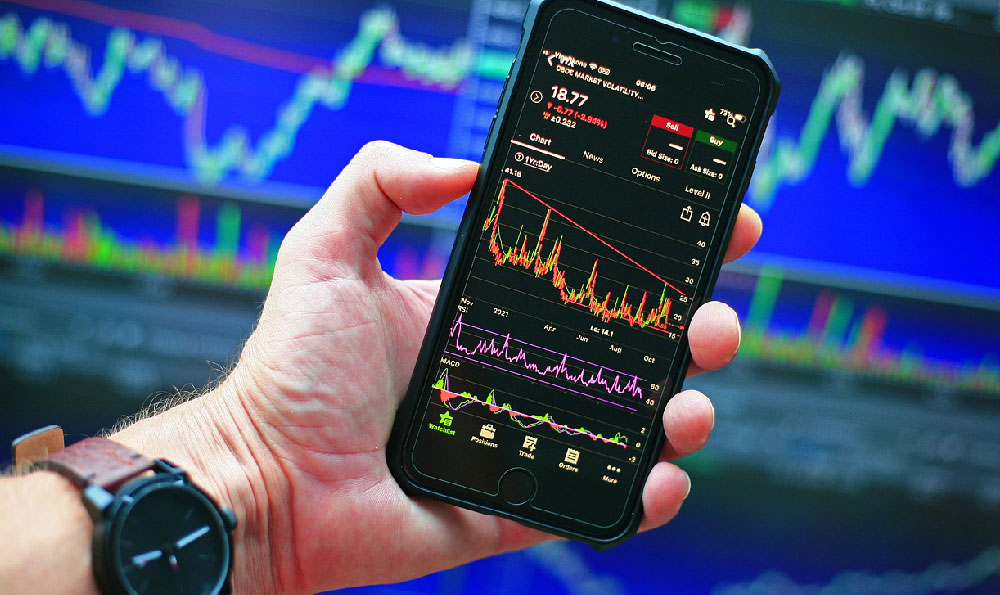
Moving Average Convergence Divergence (MACD): The MACD is a trend-following momentum indicator that shows the relationship between two moving averages of a price. It consists of the MACD line, the signal line, and a histogram. Traders often use the MACD to identify potential buy and sell signals. A bullish crossover occurs when the MACD line crosses above the signal line, suggesting a potential buy opportunity. A bearish crossover occurs when the MACD line crosses below the signal line, indicating a potential sell opportunity.
-
Fibonacci Retracement: Fibonacci retracement levels are horizontal lines that indicate potential support and resistance levels based on Fibonacci ratios (23.6%, 38.2%, 50%, 61.8%, and 100%). Traders often use Fibonacci retracement levels to identify potential entry and exit points.
Strategies for Successful Trading with Upbit Charts
-
Trend Identification: Identifying the prevailing trend is crucial for successful trading. Use moving averages and trendlines to determine whether the market is in an uptrend, downtrend, or sideways trend. Trade in the direction of the trend to increase your chances of success.
-
Support and Resistance Levels: Support levels are price levels where buying pressure is strong enough to prevent the price from falling further. Resistance levels are price levels where selling pressure is strong enough to prevent the price from rising higher. Identify potential support and resistance levels on the Upbit chart and use them to set entry and exit points.
-
Chart Patterns: Chart patterns are formations on price charts that can provide clues about future price movements. Common chart patterns include head and shoulders, double top, double bottom, triangles, and flags. Learning to recognize these patterns can help you anticipate potential price movements and make informed trading decisions.
-
Risk Management: Implement robust risk management strategies to protect your capital. Set stop-loss orders to limit potential losses and take-profit orders to secure profits. Never risk more than you can afford to lose, and diversify your portfolio to reduce overall risk. Position sizing is also crucial; don't allocate a large percentage of your capital to a single trade.
-
Fundamental Analysis: While technical analysis focuses on price charts and indicators, fundamental analysis involves evaluating the underlying factors that could affect the value of a cryptocurrency. This includes analyzing the project's team, technology, market capitalization, and adoption rate. Combining technical and fundamental analysis can provide a more comprehensive understanding of the market and improve your trading decisions.
Avoiding Investment Traps and Protecting Your Assets
-
Beware of Pump and Dumps: Pump and dump schemes involve artificially inflating the price of a cryptocurrency through misleading or false information, and then selling the assets at a profit before the price crashes. Be wary of unsolicited investment advice and avoid investing in cryptocurrencies based solely on hype.
-
Avoid FOMO (Fear of Missing Out): FOMO can lead to impulsive investment decisions. Don't rush into buying a cryptocurrency just because its price is rising rapidly. Conduct thorough research and consider your risk tolerance before investing.
-
Secure Your Wallet: Protect your cryptocurrency holdings by using a secure wallet with strong password protection and two-factor authentication. Consider using a hardware wallet for storing large amounts of cryptocurrency offline.
-
Stay Informed: The cryptocurrency market is constantly evolving. Stay informed about the latest news, trends, and regulations by following reputable sources and participating in relevant communities.
By understanding the Upbit chart, utilizing technical indicators, implementing effective trading strategies, and practicing sound risk management, you can increase your chances of success in the cryptocurrency market. Remember that investing in cryptocurrencies involves inherent risks, and it's crucial to conduct thorough research and make informed decisions. Approach the market with a cautious and disciplined mindset to protect your assets and achieve your financial goals.